
September market update (2025)
- Posted By Nikki Montaser
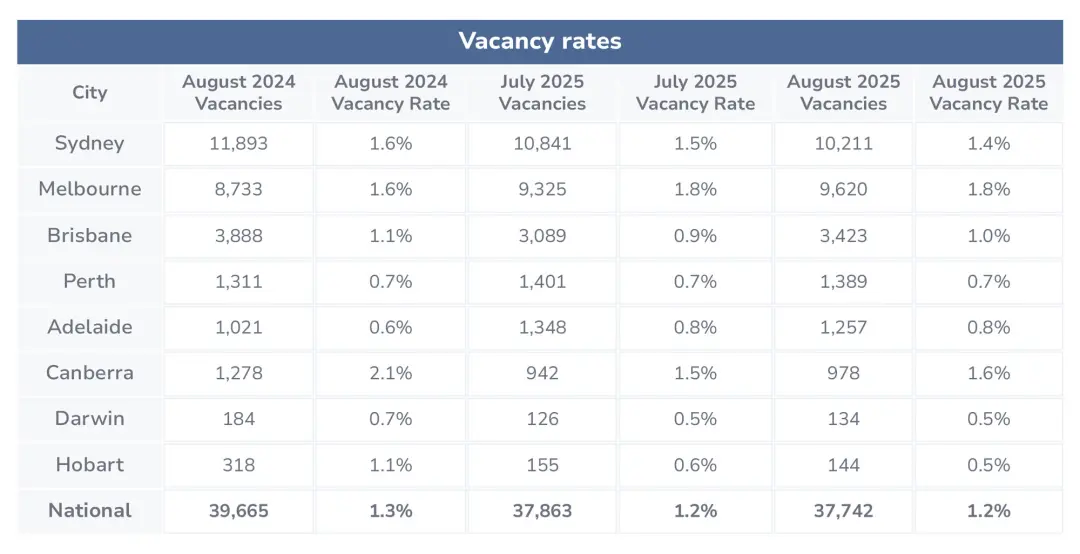
National vacancy rate stays at 1.2%
Australia’s rental vacancy rate didn’t budge in August, sitting at 1.2%, according to the latest data from SQM Research. There were 37,742 vacant properties across the country, only 121 fewer than in July. It paints a fairly steady picture of the market, with just small changes showing up across the capital cities. Overall, renters still face tough competition for homes in every capital city.
The smaller capitals are the most competitive for renters, with Hobart and Darwin holding the shared title for tightest rental market in the country.
- Hobart saw its vacancy rate fall to a very tight 0.5%, down from 0.6% in July 2025, leaving just 144 homes available.
- No changes in Darwin, which held at 0.5%, with a small rise to 134 vacancies.
- Perth’s vacancy didn’t change from 0.7%, with 1,389 properties on the market.
- Adelaide also stayed at 0.8%, with the number of empty homes increasing slightly to 1,257.
Among the capitals with vacancy rates above 1%, the results were mixed.
- Brisbane edged up to 1.0% from 0.9% the month prior, with 3,423 homes available.
- Sydney tightened to 1.4% from 1.5%, its lowest vacancy rate in more than a year, with 10,211 homes available.
- Canberra lifted to 1.6%, up from 1.5%, with 978 vacancies.
- Melbourne is still the city with the most rental availability, with the vacancy rate staying at 1.8%. The number of vacancies increased to 9,620 as leasing activity slowed.
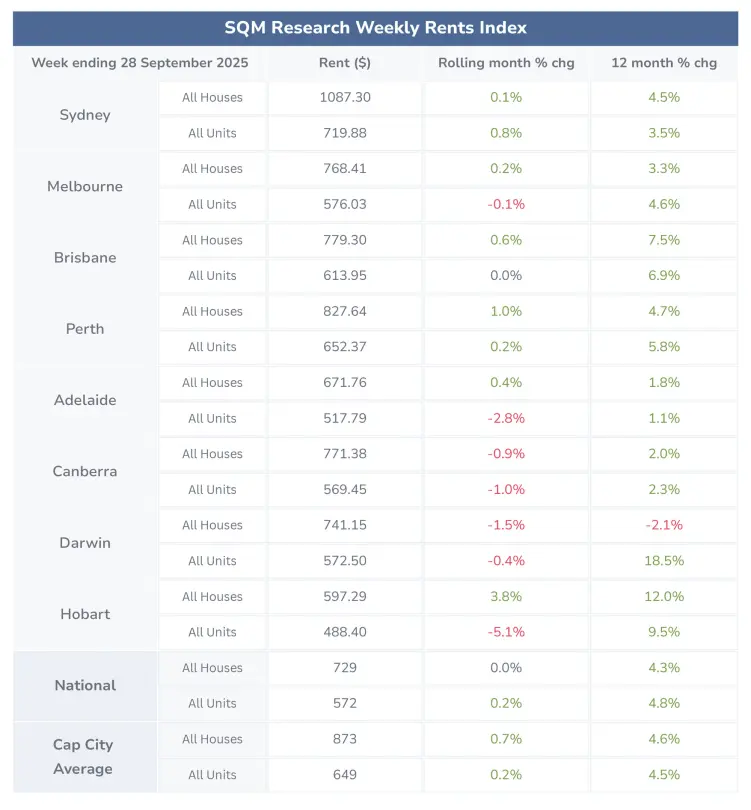
Rents edge higher in September
Nationally, advertised weekly rents for units grew faster than house rents in the 30 days to 28 September 2025.
- Houses remained at $729 a week, which is 4.3% higher than a year ago.
- Units increased by 0.2% to $578 a week, an annual rise of 4.8%.
Across the capital cities, growth was slightly stronger:
- Houses rose by 0.7% to an average of $873, up 4.6% over the year.
- Units lifted by 0.2% to $649, up by 4.5% year-on-year.
The strongest lift was seen in Hobart houses, which jumped by 3.8% in the month.
Louis Christopher, Managing Director of SQM Research, said the data suggested “ongoing shortages in rental supply across most capital cities”.
But rents didn’t go up in every city in the past month, with Hobart units seeing the biggest drop of -5.1% to $488.
- Unit rents also dropped in Melbourne (-0.1% to $576), Adelaide (-2.8% to $517), Canberra (-1.0% to $569) and Darwin (-0.4% to $572).
- House rents also slipped in Canberra (-0.9% to $771) and in Darwin (-1.5% to $741).
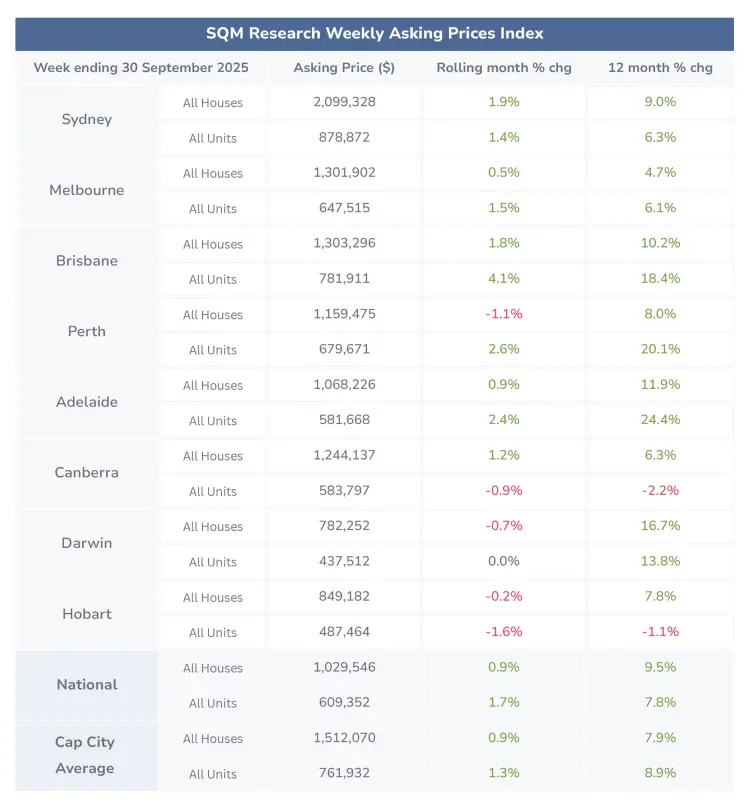
Brisbane and Adelaide lead national price growth
National asking prices continued to rise in the week ending 30 September 2025, suggesting strong confidence among sellers.
- Across Australia, house prices lifted by 0.9% over the month and are now 9.5% higher than a year ago.
- Unit values rose by 1.7% for the month and 7.8% over the year.
- Combined dwelling prices increased by 1.0% monthly and 9.2% annually.
In the latest monthly results, Brisbane and Adelaide stood out as the two strongest capital city markets.
- Brisbane saw house prices rise by 1.8% and units jump by 4.1%.
- Adelaide recorded house price growth of 0.9% and unit prices shot up by 2.4%.
- Sydney also maintained steady growth, with house and unit values for the month increasing by 1.9% and 1.4% respectively over the month.
On a yearly basis, Darwin, Brisbane and Adelaide recorded double-digit price growth across both house and unit markets.
- Darwin recorded the strongest overall gains, with house prices up by 16.7% and unit prices up by 13.8%. However, that slowed in the past month, with house prices falling by 0.7% and unit prices unchanged.
- Brisbane’s house and unit values lifted by 10.2% and 18.4% respectively year-on-year.
- House prices in Adelaide increased by 11.9%. The city’s unit market has been a standout performer over the year, surging by 24.4% since September 2024.
- Annual growth was also strong in Perth’s unit market, where values climbed by 20.1%.
But not all markets moved upward.
- Hobart saw both house and unit prices decline over the month, down by 0.2% and 1.6% respectively.
- On an annual basis, Canberra units (-2.2%) and Hobart units (-1.1%) were the only segments to fall.
Mr Christopher said: “Vendor confidence remains firm, particularly in Brisbane, Adelaide, and Perth, where annual price growth is outpacing the national average.”
“Overall, the market is showing resilience, but affordability constraints and interest rate settings will remain key factors to watch as we head deeper into the selling season.”
Cash rate stays at 3.60%
The RBA Board held the cash rate at 3.60%, leaving it unchanged from the month prior. The central bank has made three rate cuts this year, slashing the rate from 4.10% in February 2025 by 75 basis points.
These rate cuts appear to be working, with the RBA noting that private spending is on the rise.
“The housing market is strengthening, a sign that recent interest rate decreases are having an effect. Credit is readily available to both households and businesses..
Disclaimer: The information enclosed has been sourced from SQM Research and Reserve Bank of Australia, and is provided for general information only. It should not be taken as constituting professional advice.
PropertyMe is not a financial adviser. You should consider seeking independent legal, financial, taxation, or other advice to check how the information relates to your unique circumstances.
We link to external sites for your convenience. We are selective about which external sites we link to, but we do not endorse external sites. When following links to other websites, we encourage you to examine the copyright, privacy, and disclaimer notices on those websites.
Article posted by Property Me.